

Cooperation
- Alexandre Marro
- Feb 25
- 11 min read

Cooperation with others. Perception, experience, tenacity. Know when to lead and when to follow.
The History of Dollar Strength By studying the economic and geopolitical forces behind Dollar Strength movements, traders, policymakers, and investors can predict trends, hedge risks, and capitalize on dollar-driven opportunities in global markets.

Why the DXY Chart is the Best Measure of Dollar Strength
The U.S. Dollar Index (DXY) is the most widely used benchmark for tracking the strength of the U.S. dollar over time. It provides a comprehensive and objective measure by comparing the dollar against a basket of major currencies, weighted based on trade relationships.
1. DXY Captures Relative Strength of the Dollar
Unlike measuring the dollar against a single currency, the DXY index accounts for its performance across multiple major economies. It includes:
Euro (EUR) – 57.6% weighting
Japanese Yen (JPY) – 13.6% weighting
British Pound (GBP) – 11.9% weighting
Canadian Dollar (CAD) – 9.1% weighting
Swedish Krona (SEK) – 4.2% weighting
Swiss Franc (CHF) – 3.6% weighting
Since these currencies represent a large portion of global trade and financial markets, DXY gives a broad, balanced perspective of dollar strength or weakness rather than a narrow bilateral comparison.
2. DXY Reflects Global Trade & Capital Flows
The U.S. dollar is the world’s primary reserve currency and is used in:
International trade (especially in commodities like oil and gold)
Global debt markets (as many nations issue debt in USD)
Central bank reserves (as USD is the most-held currency globally)
Movements in DXY signal shifts in demand for the dollar, driven by global trade balances, economic performance, and central bank policies.
3. DXY Reacts to Monetary Policy & Interest Rate Differentials
The Federal Reserve’s actions significantly impact global dollar demand. When the Fed raises interest rates relative to other central banks:✅ Higher yields attract capital inflows, strengthening the dollar.❌ Lower rates or QE weaken the dollar by making U.S. assets less attractive.
By watching DXY, investors can anticipate macroeconomic trends, such as:
Capital flows into or out of U.S. markets
Inflationary or deflationary pressures
The impact of Fed tightening or easing cycles

DXY Price Action & Economic Drivers (1971–Present)
The U.S. Dollar Index (DXY) measures the strength of the U.S. dollar relative to a basket of major foreign currencies. Since its inception in 1973, its price action has been shaped by monetary policies, geopolitical events, economic crises, and trade dynamics. Below is an overview of the most significant economic events that have contributed to DXY’s movement over the last five decades.

DXY Price Action (1971–1987): The Rise and Fall of the U.S. Dollar
Between 1971 and 1987, the U.S. Dollar Index (DXY) experienced two major phases:
1971–1980: The collapse of Bretton Woods led to a weak dollar and high inflation.
1980–1985: The Volcker shock and Reaganomics triggered a massive dollar rally.
1985–1987: The Plaza Accord led to a controlled dollar depreciation.
Each phase was driven by significant economic and geopolitical events that shaped the global monetary system.
1. Post-Nixon Shock & Dollar Depreciation (1971–1980)

What Happened?
The Nixon Shock (1971):
On August 15, 1971, President Richard Nixon announced the suspension of the U.S. dollar’s convertibility into gold, effectively ending the Bretton Woods system that had governed global finance since World War II.
Prior to this, the dollar was pegged to gold at $35 per ounce, with foreign governments allowed to exchange their U.S. dollars for gold.
Due to rising U.S. inflation, trade deficits, and excessive government spending on the Vietnam War and social programs, confidence in the dollar declined, prompting foreign nations (especially France) to redeem their dollar reserves for gold.
Floating Exchange Rates & Inflation:
With the gold standard abolished, the dollar became a free-floating currency, subject to market forces.
In the early 1970s, the U.S. printed more money to cover deficits, leading to higher inflation.
1973 Oil Crisis: The OPEC embargo quadrupled oil prices, further weakening the dollar and causing inflation to spike to double digits.
The Federal Reserve kept interest rates low, failing to control inflation, which reached 14.8% by 1980 (stagflation).
Impact on DXY: 📉
DXY dropped from ~120 (1971) to around 80 by 1978, reflecting a loss of confidence in the dollar.
The weak dollar led to higher import prices, worsening inflation and fueling capital flight from the U.S.
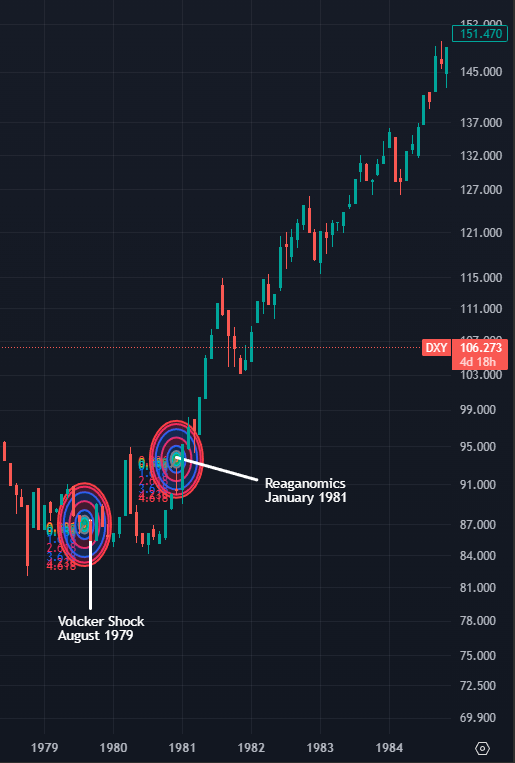
2. 1980s: The Volcker Shock & Dollar Strength (1980–1985)
What Happened?
Paul Volcker & Interest Rate Hikes (1979–1982):
In August 1979, Paul Volcker was appointed Chairman of the Federal Reserve and immediately took aggressive action against inflation.
Volcker raised interest rates to an unprecedented 20% (1980–1981), drastically increasing borrowing costs to slow inflation.
As inflation declined, confidence in the dollar returned, leading to a massive dollar rally.
Reaganomics & Economic Growth (1981–1985):
President Ronald Reagan cut taxes and deregulated industries, fueling a rapid economic recovery.
The U.S. government increased military spending, running large deficits that required higher interest rates to attract foreign capital.
Impact on DXY: 📈
DXY surged from ~80 in 1980 to a peak of 160 by 1985 (the strongest dollar in history).
The strong dollar hurt U.S. exporters, leading to a widening trade deficit and pressure for policy intervention.
3. The Plaza Accord & Dollar Weakness (1985–1995)

What Happened?
The Plaza Accord (1985):
By 1985, the overvalued dollar was crushing U.S. manufacturers, making exports expensive and imports cheap.
The U.S. met with Japan, Germany, France, and the U.K. at the Plaza Hotel in New York and agreed to coordinate efforts to weaken the dollar.
Central banks intervened in currency markets by selling USD and buying foreign currencies.
Louvre Accord (1987) & Stabilization:
The dollar depreciated too quickly, leading to the Louvre Accord (1987), which aimed to stabilize it.
The 1987 Stock Market Crash (Black Monday) increased market volatility, further affecting the dollar.
The early 1990s saw a mild U.S. recession (1990–1991), exacerbating dollar weakness.
Impact on DXY: 📉
DXY collapsed from 160 (1985) to ~85 by 1987 and continued to fluctuate in the 80s-90s range.
A weaker dollar helped U.S. exports but increased inflationary risks.
DXY Price Action (1987–2000): Volatility, Crises, and the Tech Boom

From 1987 to 2000, the U.S. Dollar Index (DXY) experienced significant volatility, with three distinct phases:
1987–1995: A weak dollar as the effects of the Plaza Accord persisted, but with temporary rebounds.
1995–1998: A sharp dollar rally fueled by strong U.S. economic growth and global instability.
1998–2000: A final surge in the dollar driven by the dot-com boom before peaking in early 2000.
Let’s break down these movements and the economic forces behind them.
1. 1987–1995: A Weak Dollar with Temporary Rebounds
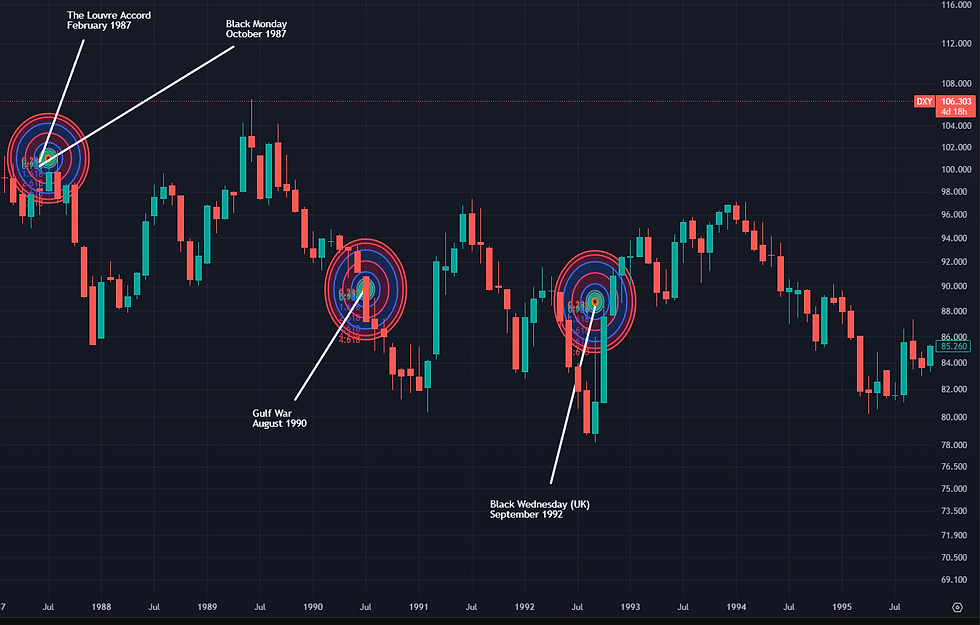
Louvre Accord (1987): Effort to Stabilize the Dollar
After the Plaza Accord (1985) forced a dollar depreciation, the Louvre Accord (1987) was meant to halt further decline.
The Federal Reserve raised interest rates in response to the 1987 stock market crash, providing some short-term support to the USD.
📉 Impact on DXY: From 85 in early 1988, DXY continued to decline, reaching 78 by 1991.
1990–1991: Gulf War & Recession
Iraq invaded Kuwait in 1990, leading to oil price spikes and economic uncertainty.
The U.S. economy entered a recession in 1990–1991, further weakening the dollar.
The Fed cut interest rates aggressively to stimulate growth.
📉 Impact on DXY: The dollar remained weak, reaching its lowest levels (~78) by 1991.
1992–1995: Currency Market Turmoil & Weak Dollar
1992: The European Exchange Rate Mechanism (ERM) crisis led to speculative attacks on the British pound, forcing the U.K. to exit the ERM (Black Wednesday).
The Fed kept rates low, further weakening the dollar.
The U.S. trade deficit widened, putting downward pressure on the USD.
📉 Impact on DXY: The dollar remained in a bearish trend, hitting a multi-year low of ~80 in early 1995.
2. Mid 1990s–Early 2000s: Tech Boom & Dollar Strength (1995–2002)
What Happened?
Dot-Com Boom & U.S. Dominance (1995–2000):
The U.S. economy surged in the late 1990s due to rapid technological advancements and a booming stock market.
Foreign investors flocked to U.S. assets, increasing demand for dollars.
The Asian Financial Crisis (1997) triggered capital flight to the dollar as investors sought safety.
1995: The Dollar Bottoms & Reverses Up
In April 1995, Treasury Secretary Robert Rubin and the Fed shifted policy to support the dollar, signaling an end to the prolonged weakness.
The Fed raised interest rates, making U.S. assets more attractive.
Japan’s weak economy and banking crisis led to capital outflows, strengthening the dollar.
📈 Impact on DXY: The dollar rallied from ~80 in 1995 to 100 by 1997.
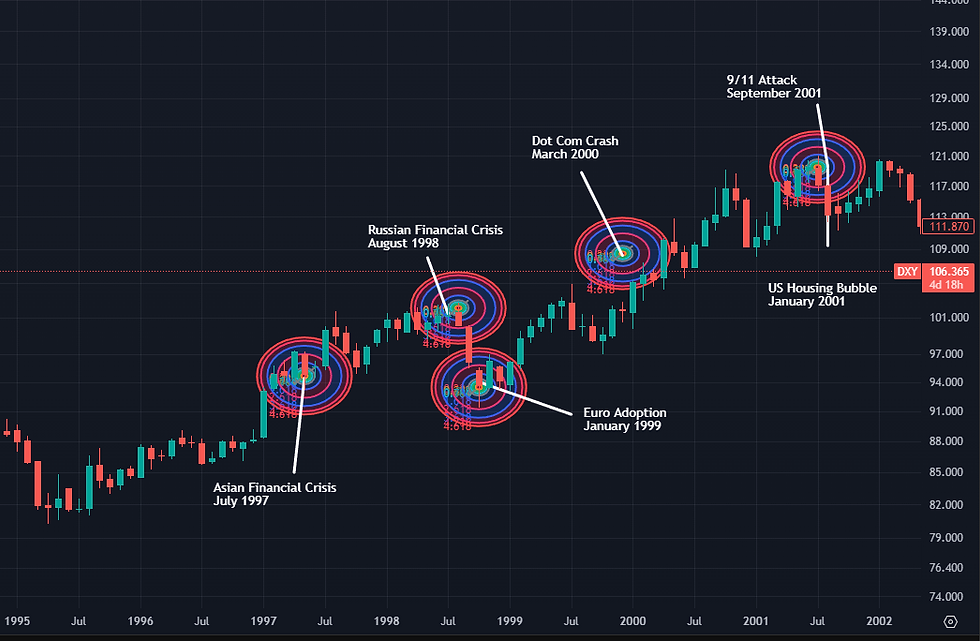
1997–1998: Asian Financial Crisis & Safe-Haven Demand for USD
The Asian Financial Crisis (1997) devastated Thailand, South Korea, Indonesia, and other emerging markets, leading to capital flight into the U.S. dollar.
The Russian Financial Crisis (1998) further increased global instability, strengthening the USD.
📈 Impact on DXY: The dollar surged to 105 in late 1998, benefiting from safe-haven demand.
DXY Price Action (2001–2010): A Decade of Dollar Decline, Crisis, and Recovery

Between 2001 and 2010, the U.S. Dollar Index (DXY) experienced dramatic shifts due to:
2001–2003: Post-Dotcom Bubble → 9/11 → Fed Rate Cuts → Dollar Weakens
2003–2007: U.S. Twin Deficits → Housing Boom → Continued Dollar Decline
2007–2009: Global Financial Crisis → Initial Dollar Drop → Safe-Haven Surge
2009–2010: Fed QE & Economic Recovery → Dollar Stabilization
Each phase was influenced by monetary policy, economic crises, and shifts in global investor sentiment. 1. 2001–2008: Dollar Decline from Twin Deficits & Fed Easing

What Happened? 1. 2001–2003: Post-Dotcom Crash & 9/11 Weaken the Dollar
2001: Dotcom Bubble Burst & Rate Cuts Begin
In 2000–2001, the dotcom bubble collapsed, wiping out trillions in market value.
The U.S. economy slowed, and the Federal Reserve under Alan Greenspan aggressively cut interest rates from 6.5% (2000) to 1.75% (2001) to stimulate growth.
Lower interest rates reduced the dollar’s appeal, leading to capital outflows.
📉 Impact on DXY: The dollar peaked at ~120 in early 2001, then declined.
2001: 9/11 Attacks & Geopolitical Uncertainty
On September 11, 2001, terrorist attacks in the U.S. caused a massive financial shock.
Investors initially sought safety in the dollar, but as the Fed slashed rates further, the dollar resumed its decline.
The U.S. launched wars in Afghanistan (2001) and Iraq (2003), increasing government spending and deficits.
📉 Impact on DXY: The dollar fell from 120 (2001) to ~108 by mid-2002.
2002–2003: Twin Deficits & Start of a Secular Dollar Bear Market
By 2002–2003, the U.S. had growing budget deficits (due to war spending) and a current account deficit (trade imbalance).
The Bush administration favored a weaker dollar to boost exports, reinforcing the dollar downtrend.
The European Union (EU) strengthened, leading to a rising euro (€), which gained confidence as an alternative reserve currency.
📉 Impact on DXY: The dollar collapsed from ~108 (2002) to ~88 (2004).
2003–2006: Easy Money & The Rise of the Euro
The Fed kept rates low (1%) until mid-2004, fueling a real estate and credit boom.
The euro surged as Europe’s economy outperformed expectations and attracted capital flows.
The Chinese yuan remained pegged to the dollar, further worsening the U.S. trade deficit.
📉 Impact on DXY: The dollar continued falling, reaching ~80 by late 2004.
2006–2007: Fed Rate Hikes & Temporary Dollar Stability
By mid-2004, the Fed began raising rates, reaching 5.25% by 2006 to combat inflation.
Higher rates briefly stabilized the dollar, but by 2007, concerns over subprime mortgage debt emerged.
📉 Impact on DXY: The dollar hovered around 80–85 between 2005 and early 2007.
3. 2007–2010: Global Financial Crisis & Dollar Whiplash
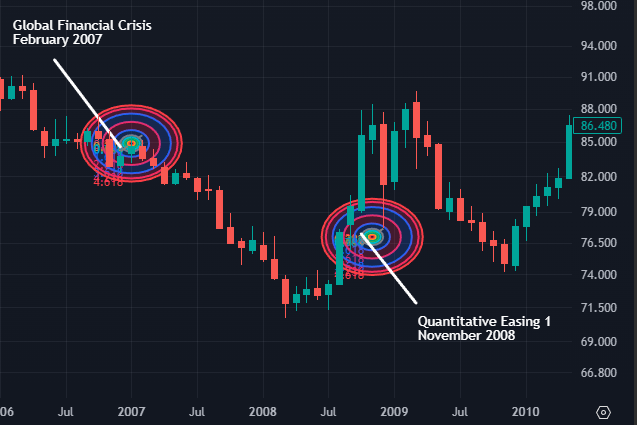
2007–2008: Housing Collapse & Initial Dollar Drop
In 2007, the U.S. housing market collapsed, triggering panic in credit markets.
The Fed cut rates aggressively, leading to a weaker dollar.
Investors fled to commodities (oil, gold, emerging markets), further pressuring the dollar.
📉 Impact on DXY: The dollar fell to a multi-decade low of ~71 in March 2008.
2008–2009: Lehman Collapse & Flight to Safety
In September 2008, Lehman Brothers collapsed, triggering a global financial meltdown.
Investors rushed into the U.S. dollar as a safe-haven asset.
The Fed launched quantitative easing (QE1) in late 2008, pumping trillions into the banking system.
📈 Impact on DXY: The dollar surged from 71 (March 2008) to ~89 (March 2009).
2009–2010: Fed Policy Stabilizes the Dollar
In 2009–2010, QE1 provided liquidity, helping stabilize financial markets.
However, low U.S. interest rates and massive government debt weakened long-term confidence in the dollar.
The eurozone recovered faster, leading to renewed euro strength against the dollar.
📉 Impact on DXY: The dollar declined from ~89 (March 2009) to ~75 by mid-2010.
DXY Price Action (2010–2025): A Journey Through Economic Turbulence and Policy Shifts

Between 2010 and 2025, the U.S. Dollar Index (DXY) experienced significant fluctuations influenced by:
2010–2013: Post-Recession Recovery → Eurozone Crisis → Dollar Strengthens
2014–2016: Fed Tapering → Rate Hikes → Dollar Rally
2017–2019: Trade Wars → Tax Reforms → Dollar Volatility
2020–2022: COVID-19 Pandemic → Economic Stimulus → Dollar Weakness
2023–2025: Policy Shifts → Tariff Threats → Dollar Resilience
Each phase was shaped by monetary policies, global economic events, and geopolitical tensions. 1. 2010–2013: Post-Recession Recovery & Eurozone Crisis

2010–2011: U.S. Economic Recovery Amidst Global Uncertainty
Post-2008 Financial Crisis, the U.S. implemented quantitative easing (QE) to stimulate growth.
The Federal Reserve's accommodative policies kept interest rates near zero.
Eurozone debt crisis (e.g., Greece, Ireland) led investors to seek safety in the U.S. dollar.
📈 Impact on DXY: The dollar strengthened, with the DXY rising from ~75 in 2010 to ~84 by mid-2010 2012–2013: Continued Eurozone Turmoil & Safe-Haven Flows
Ongoing Eurozone instability (e.g., Spain, Italy) heightened market volatility.
The U.S. economy showed resilience, attracting global capital.
The Fed's Operation Twist aimed to flatten the yield curve, supporting economic growth.
📈 Impact on DXY: The dollar maintained strength, with the DXY fluctuating between ~79 and ~84.
2. 2014–2016: Fed Tapering & Rate Hikes Fuel Dollar Rally
2014: Taper Tantrum & Diverging Monetary Policies
The Fed announced tapering of its QE program, signaling confidence in economic recovery.
Interest rate differentials favored the dollar as other central banks maintained accommodative stances.
Commodity prices, notably oil, declined, benefiting the U.S. economy.
📈 Impact on DXY: The dollar rallied, with the DXY climbing from ~80 in early 2014 to ~90 by year-end.
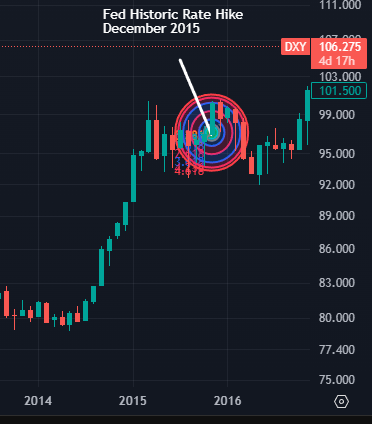
2015–2016: Rate Hikes & Global Economic Concerns
The Fed raised interest rates in December 2015 for the first time since 2006.
Global growth concerns, especially in China, led to market volatility.
The dollar remained strong as investors sought higher yields.
📈 Impact on DXY: The dollar peaked, with the DXY reaching ~100 in early 2015, then stabilizing around ~95–100 through 2016.
3. 2017–2019: Trade Wars & Tax Reforms Introduce Volatility

2017: Policy Uncertainty & Tax Reform
The Trump administration's policy agenda, including tax reforms, created market speculation.
Geopolitical tensions (e.g., North Korea) added to investor caution.
The Tax Cuts and Jobs Act aimed to stimulate domestic growth.
📉 Impact on DXY: The dollar weakened, with the DXY declining from ~103 in early 2017 to ~89 by early 2018.
2018–2019: Trade Wars & Fed Policy Adjustments
Escalating U.S.-China trade tensions led to tariffs and retaliations, impacting global trade.
The Fed continued gradual rate hikes but signaled a more cautious approach in 2019.
Global economic slowdown concerns prompted shifts in investor sentiment.
📈 Impact on DXY: The dollar experienced volatility, with the DXY fluctuating between ~89 and ~98 during this period.
4. 2020–2022: COVID-19 Pandemic & Economic Stimulus

2020: Pandemic-Induced Recession & Unprecedented Stimulus
The COVID-19 pandemic led to global economic shutdowns and a sharp recession.
The Fed slashed interest rates to near zero and launched extensive QE programs.
Massive fiscal stimulus packages were implemented to support the economy.
📉 Impact on DXY: The dollar weakened, with the DXY dropping from ~102 in March 2020 to ~89 by year-end.
2021–2022: Recovery & Inflationary Pressures
The U.S. economy rebounded due to vaccine rollouts and reopening efforts.
Inflation rates increased, leading to debates on monetary policy adjustments.
The Fed signaled tapering of asset purchases and potential future rate hikes.
📈 Impact on DXY: The dollar strengthened, with the DXY rising from ~89 in early 2021 to ~96 by end of 2022.
5. 2023–2025: Policy Shifts & Tariff Threats

2023–2024: Political Changes & Economic Strategies
The re-election of President Donald Trump in 2024 introduced new economic policies.
Discussions emerged about a potential "Mar-a-Lago Accord", aiming to devalue the dollar to address trade imbalances.
Fiscal policies focused on reducing deficits and stimulating growth, with debates on their long-term impacts.
📉 Impact on DXY: The dollar experienced fluctuations, with the DXY reaching ~107.87 by January 2025.


Comments